













5th Workshop on Maritime Computer Vision (MaCVi)
MaCVi @ WACV 2027
Tuesday, January 5, 2027, afternoon (Orlando local time), per WACV’s draft schedule. Exact times and room to be confirmed.
EURS: Embedded Underwater Restoration and Segmentation
Challenge deadlines and author metadata (Teams & paper)
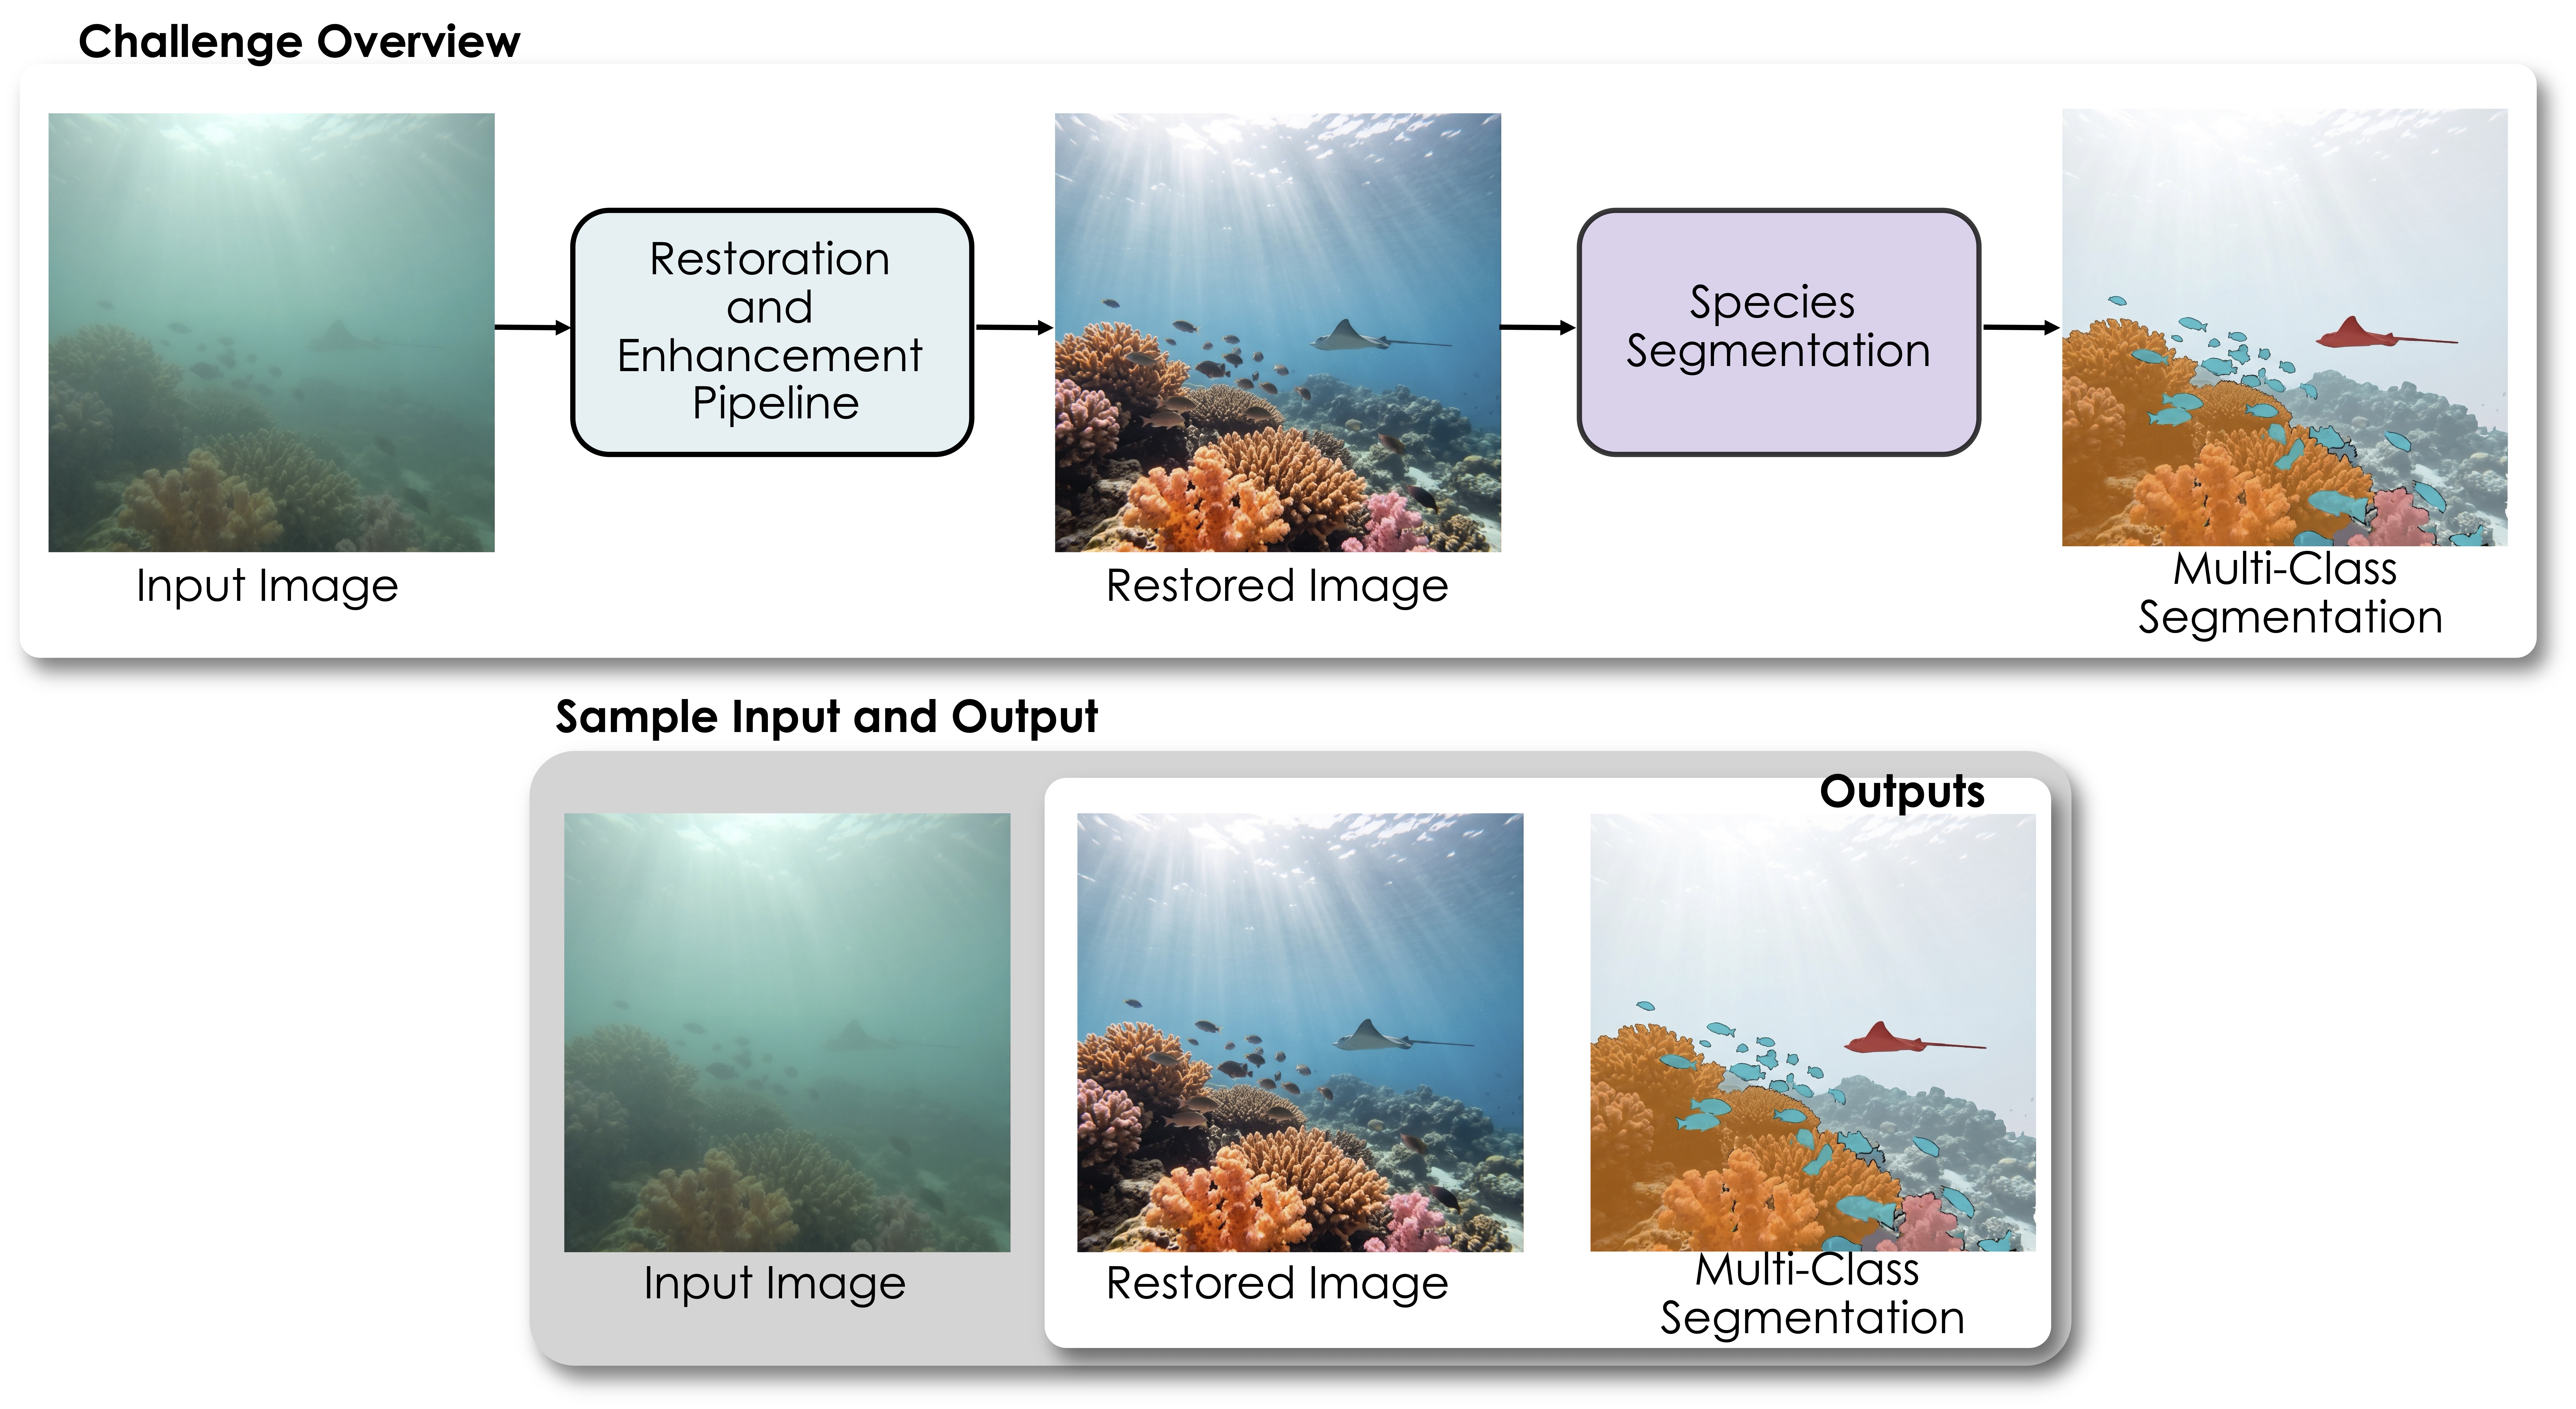
Underwater imagery is degraded by color distortion, light scattering, and low visibility, which makes downstream perception tasks — like identifying and localizing marine life — substantially harder than on clean images. EURS combines two coupled tasks into a single challenge: restoring a degraded underwater image, and segmenting it into marine-relevant classes.
Challenge Schedule
| Event | Date |
|---|---|
| Author details and active OpenReview profiles confirmed | October 23, 2026, 23:59 AoE |
| All challenges close (final submission deadline) | October 27, 2026, 23:59 AoE |
| Final results and winner notification | October 30, 2026 |
EURS schedule (Track 1 and Track 2)
| Event | Date |
|---|---|
| EURS testing phase starts | October 20, 2026, 00:00 AoE |
| EURS testing phase ends; all challenges close | October 27, 2026, 23:59 AoE |
| EURS codebase and method description due | October 28, 2026, 23:59 AoE |
| EURS evaluation period | October 28–30, 2026 |
| Provisional EURS ranking released; final EURS leaderboard and rankings announced by the end of the day | October 30, 2026, by 23:59 AoE |
Details of the testing phase and of the final evaluation are on the EURS challenge page. All dates and deadlines are AoE.
You can begin developing and submitting challenge results before completing author metadata. Already have an OpenReview account? Find your profile link at openreview.net/profile. Need one? Create an OpenReview account now: activation can take up to two weeks.
AoE means Anywhere on Earth (UTC−12). The organizers will hand off the summary paper's final metadata by November 2, 2026. The archival camera-ready deadline is November 20, 2026, 23:59 Pacific Time (PST, UTC−8). See the paper publication schedule for details.
Testing phase and final evaluation
How the testing phase works
- Nothing changes in how you submit. The submission formats, image resolution rules, file formats, evaluation methods and the starter kit are the same as in the development phase. Only the data you are scored on changes.
- Track 1: download the new testing-phase images (6 scenes, 200 degraded versions each, no ground truth), run your pipeline on them and upload the zip as before. The upload limit is 1 GB, and during the testing phase you may submit at most 3 times per day (submissions that fail do not count towards this limit). Testing-phase images
- Track 2: there is nothing to download. Your ONNX model is run on our Jetson AGX Orin against a private test set that is never shared. During the testing phase you may submit at most 1 scored (fully evaluated) submission per team per day, and each evaluation takes longer than during development because the test set is larger. Only one of your team's submissions can be waiting or running at a time; upload the next one after the previous result has come back.
- Leaderboards: every submission made from the start of the testing phase carries a Testing phase label next to the MaCVi 27 label. Both phases appear in the same table; the label tells them apart.
Final evaluation
- Final ranking is based solely on testing-phase submissions and on whether your results can be reproduced. Development-phase scores do not count.
- Report your best submissions. In your team's metadata you report your best testing-phase submission in each track (the submission IDs from the leaderboards). This is a single team-level entry that covers both tracks, not a separate procedure per track.
- Reproducibility. By October 28, 2026 (23:59 AoE) every team hands in its codebase, trained weights and a method description, as listed in the schedule above. During the evaluation period (October 28–30) the organizers re-run the submissions you reported. The reproduced results must reflect the same metrics as the ones you reported and as shown on the testing-phase leaderboards, within normal run-to-run variation on different machines; results that cannot be reproduced are not ranked.
- Both tracks and the weights. The EURS ranking combines Track 1 and Track 2. To be ranked, a team needs a reproduced testing-phase result in both tracks. For each track, the reproduced score of the team's reported best submission (the primary score of that track's leaderboard) is min-max normalised across these teams, so the best team in a track gets 1 and the lowest gets 0. The final score is F = 0.70 × (Track 2 normalised score) + 0.30 × (Track 1 normalised score), and teams are ranked by F. Ties are broken by the Track 2 score, then the Track 1 score.
- Summary paper. Teams that do not submit to the testing-phase leaderboard are not eligible for the challenge summary paper. Completing the author details by October 23 is still required, and does not by itself guarantee inclusion.
The final EURS leaderboard and rankings are announced by October 30, 2026 (AoE). Questions about the testing phase? Ask on Discord.
Track 1: Public Dev-Set Leaderboard
Quick links: Dataset download Submit Leaderboard Ask for help
Overview
Both restoration and segmentation are scored against the same Dev-split ground truth, so a submission needs to get both the pixel-level restoration and the semantic understanding right. This leaderboard runs entirely server-side against the public Dev split, with no device or power constraints and no submission limit beyond a daily cap — use it to iterate while developing. It does not require any special hardware and carries less weight than Track 2 towards final standings. From October 20 this leaderboard is scored on the testing-phase images instead; see Testing phase and final evaluation.
Task
Given a degraded underwater image, participants must produce two outputs for it:
- A restored image — the same scene with underwater degradation (color cast, haze, low contrast) corrected.
- A segmentation mask — a single-channel image labeling every pixel with one of 5 classes:
background,coral,fish,elasmobranch(sharks and rays),other.
Dataset
The dataset consists of real underwater scenes, each provided as one clean ground-truth image/mask pair and multiple synthetically degraded versions of that scene (simulating different water conditions and depths). The Dev split — the split scored by this leaderboard — is available as a direct download:
Download the EURS Dev-split dataset
Evaluation Metrics
This leaderboard's primary ranking metric is the same composite score used by Track 2:
composite = 0.6 × Qseg + 0.3 × (0.45 × PSNRnorm + 0.45 × SSIM + 0.10 × sharpness_ratio) + 0.1 × NRquality
where Qseg = F1 × mIoU × coverage_penalty rewards submissions that get both segmentation coverage (F1) and per-class accuracy (mIoU) right, and NRquality is the mean of UIQM/UCIQE/CCF, each normalized over an empirically-observed range (see Track 2's Evaluation Metrics for the full rationale, including why that no-reference group is capped at a small combined weight). The full set of metrics reported:
- Qseg, mIoU, F1 — segmentation accuracy across the 5 classes.
- PSNR, SSIM, sharpness_ratio — restoration fidelity against the ground-truth clean image and an anti-blur signal.
- UIQM, UCIQE, CCF — underwater-specific, no-reference image quality metrics, contributing to the composite above at a small combined weight.
Submission Zipfile Preparation Guidelines
- Submit a single
.ziparchive containing two folders at its root:restored/andseg_masks/. - For every degraded image of the current phase (the Dev split during development, the testing-phase images from October 20), include one output in each folder, named after the degraded image (matching filename stem, any common image extension for
restored/). - Segmentation masks must be single-channel PNGs with integer pixel values
0–4(background/coral/fish/elasmobranch/other, in that order). Masks with out-of-range values or the wrong number of channels will be rejected. - Every output must be resized to exactly the resolution the evaluator scores at (longest side capped at 1024px, aspect-preserved from the original scene) — the evaluator does not resize submissions itself, so a mismatched size is rejected outright, not silently corrected. Submissions larger than 2048px on the longest side are rejected before scoring even starts.
- Run the starter kit's
resize_for_submission.pyas the mandatory last step of your pipeline to get this exactly right — it computes each scene's exact target size from your downloaded degraded images and resizes your raw outputs to match, so you never have to compute this yourself. - A submission must include both outputs for every image of the current phase. Incomplete submissions are rejected outright rather than silently scored on a subset.
Participate
To participate in the challenge follow these steps:
- Download the EURS Dev-split dataset (during the testing phase: the testing-phase images, linked in Testing phase and final evaluation).
- Train a model (or pipeline) that restores the degraded input and predicts a per-pixel class mask. You may use additional publicly available training data, but must disclose it at submission time.
- Generate
restored/andseg_masks/outputs for every image of the current phase, following the format above. - Run
resize_for_submission.pyon your outputs — this is mandatory, not optional; the evaluator rejects any output whose size doesn't exactly match what it expects, and this script is the supported way to get that right without computing it yourself. - Package both resized folders into a single
.zipwithrestored/andseg_masks/at the archive root (no extra nesting). - Upload your
.zipfile on the upload page. You'll need to register to submit.- Evaluation runs on the server and typically takes 10–20 minutes for a full submission. Refresh the dashboard page to see results; it will also show details on any failed submission (hover over the error icon).
- During the development phase you may submit at most 10 times per day to the public leaderboard; during the testing phase (from October 20) the limit is 3 times per day. Submissions that fail do not count towards this limit, but double-check your archive format before uploading to save yourself the wait.
Terms and Conditions
- During the development phase this public leaderboard is for self-evaluation. Only testing-phase submissions count towards the final ranking (see Final evaluation), and Track 2 (embedded, Jetson AGX Orin) carries more weight towards prizes and the results paper.
- You are allowed to use additional publicly available data for training but must disclose it at the time of submission. This also applies to pre-training.
- Note that we (as organizers) may upload reference models for this challenge, but they do not compete for a winning position — they serve only as a reference point on the leaderboard.
Track 2: Embedded (Jetson AGX Orin)
Quick links: Submit Leaderboard Self-check your model's GFLOPs/params Ask for help
Overview
Track 2 runs your submitted ONNX model itself — not pre-computed prediction images — directly on our judging hardware: a Jetson AGX Orin, locked to JetPack/L4T 7.2.1 (r39.2.1), stock nvpmodel MODE_30W, with a 16GB memory cap. The same environment and thresholds apply to every submission, published here so everyone targets the same bar. The exact model you submit produces the restored/ and seg_masks/ outputs used for accuracy scoring and is the thing timed and power-measured for the efficiency metrics — this ties both scores to the same artifact, so a fast dummy model paired with offline-computed predictions can't game the efficiency numbers. Accuracy is scored on a private, held-out Test split (never used by Track 1's Dev-split leaderboard), so repeated Track 1 iteration can't leak information about Track 2's scoring data.
Because evaluation involves compiling and running your model on real physical hardware, results are not immediate — a submission typically takes 15–20 minutes to come back (one to one and a half hours in the testing phase, which uses a larger test set) (engine compile, a sustained-load measurement window, then real inference over the full Test split). Refresh the dashboard to see results once ready.
Submission Format
- Submit a single self-contained
.onnxfile — not a zip, not prediction images. Embed all weights in the same file (save_as_external_data=Falseif exporting withtorch.onnx.exportor viaonnx.save_model); a companion.onnx.datafile is fragile to package and transfer correctly, so it is not supported for submission. - The graph must use a static input shape (no dynamic axes). This is required for exact compute counting below, and for the TensorRT engine build on the judging hardware.
- You are free to choose your own input resolution, as long as the model clears the compute cap below at that resolution. The organizers' own reference baseline runs at 384×768, given here as a concrete data point, not a requirement.
ONNX I/O Contract
Your model must expose exactly these input/output tensors. This is now checked and rejected before your submission ever reaches the judging hardware, with a specific error naming exactly what's wrong — but matching it up front saves you a submission slot, since Track 2 allows only one per day.
- Input — a single 4D tensor
(1, 3, H, W), RGB, normalized to 0–1 float32 (not raw 0–255). Any tensor name is fine; it's read automatically from your ONNX graph.H, Wis whatever static resolution you chose above. - Output —
restored_image(name must match exactly, case-sensitive): shape(1, 3, H, W), float values in 0–1 (not 0–255). - Output —
seg_logits(name must match exactly, case-sensitive): shape(1, 5, H, W)— raw per-class logits/scores, not a pre-argmaxed class-id mask. The 5 channels correspond, in order, tobackground, coral, fish, elasmobranch, other(the same classes described above). The evaluator applies argmax itself.
Design-Space Cap (checked before your model ever touches the hardware)
Your submitted graph's total compute and parameter count are checked statically, before anything runs on the Jetson:
- ≤ 12 GFLOPs (Conv/Gemm/MatMul, computed via static ONNX shape inference)
- ≤ 1.0M parameters
Run the same check yourself locally, on your own machine — wherever you already exported the ONNX file — before submitting, so you don't spend a submission slot on a model that would fail this stage: download check_submission_flops.py, install its one dependency (pip install onnx), then run python check_submission_flops.py --onnx your_model.onnx (defaults already match the locked caps above). It's a plain static analysis of the ONNX graph — no GPU, no Jetson, and no server round-trip needed to use it. A local PASSED only means your model clears this one design-space gate — it doesn't run your model, so it can't tell you anything about accuracy or real-hardware speed/energy. Those only come back from an actual Track 2 submission.
Evaluation Pipeline
Every submission goes through the same stages, in order, stopping at the first failure:
- Static compute/parameter check — the GFLOPs/params cap above. Fails fast, before your model ever reaches the Jetson.
- I/O contract check — validates the input/output tensor names, shapes, and channel count above. Also fails fast, before your model reaches the Jetson.
- TensorRT engine compile on the judging hardware — fails if your ONNX graph doesn't compile for the target TensorRT version.
- Quick throughput check — a short sanity pass.
- Sustained-load measurement — throughput and energy-per-frame under continuous real load, not a single burst.
- Real inference over the private Test split's degraded images, run directly on the Jetson.
- Accuracy scoring of those on-device outputs against ground truth.
- A combined result is returned: either full scores, or a rejection naming the exact stage and reason.
Evaluation Metrics
Track 2's primary ranking metric is the composite score:
composite = 0.6 × Qseg + 0.3 × (0.45 × PSNRnorm + 0.45 × SSIM + 0.10 × sharpness_ratio) + 0.1 × NRquality
where Qseg = F1 × mIoU × coverage_penalty (the same per-class IoU floor as Track 1 — drives Qseg to exactly 0 if any present class is essentially ignored), PSNRnorm normalizes PSNR over a 15–35dB window, and NRquality is the mean of UIQM/UCIQE/CCF, each normalized over an empirically-observed range. This no-reference group is deliberately capped at a small combined weight: no-reference image quality metrics are known to be gameable (e.g. via contrast/saturation stretching) without reflecting genuine restoration quality — confirmed on our own data, where CCF actually scores higher on degraded inputs than on an honestly restored image. The full set of metrics reported:
- Qseg, mIoU, F1 — segmentation, same definitions as Track 1.
- PSNR, SSIM, sharpness_ratio — restoration fidelity and an anti-blur signal, same definitions as Track 1.
- UIQM, UCIQE, CCF — no-reference underwater image quality metrics, same definitions as Track 1, here contributing to the composite at low combined weight as described above.
- GFLOPs and Params — the design-space numbers above, reported alongside your score.
- Throughput (QPS) and Energy (mJ/frame) — real, sustained-load measurements on the judging hardware. These are reported for transparency and do not currently gate submissions (no pass/fail threshold is enforced on them yet) — only the GFLOPs/params cap above is actually enforced.
Participate
- Train your model as for Track 1, then export it to a single self-contained
.onnxfile with a static input shape. - Run
check_submission_flops.pylocally and confirm it printsPASSED. - Upload the
.onnxfile directly on the upload page. You'll need to register to submit.- During the testing phase (from October 20) you may submit at most 1 scored submission per team per day. During the development phase you may submit at most 3 times per day to this track — it runs on a single physical judging device, so slots are limited. Only fully evaluated submissions count towards this limit; failed or rejected ones do not, but each one still takes time on the device, so self-check locally first.
- Only one submission per team can be waiting or running at a time, so a new upload is refused until the previous one has finished or failed.
- Results are asynchronous and typically take 15–20 minutes during development and one to one and a half hours during the testing phase. Refresh the dashboard page to see them; it will also show the failing stage and reason for any rejected submission.
Terms and Conditions
- Track 2 carries more weight than the Track 1 public leaderboard towards final challenge standings, prizes, and the results paper. Only testing-phase submissions count towards the final ranking (see Final evaluation).
- Same data-disclosure rule as Track 1: additional publicly available training/pre-training data is allowed but must be disclosed at submission time.
- Organizer reference models may appear on this leaderboard for comparison; they do not compete for a winning position.
Data provenance and citation
The synthetically degraded versions of each scene in the EURS dataset (shared by both tracks) are generated with RSUIGM, our image-formation-model-based method for realistic synthetic underwater image generation, published in ACM Transactions on Multimedia Computing, Communications, and Applications. If you use the EURS dataset, please cite:
@article{desai2025rsuigm,
  title   = {{RSUIGM}: Realistic Synthetic Underwater Image Generation with Image Formation Model},
  author  = {Desai, Chaitra and Benur, Sujay and Patil, Ujwala and Mudenagudi, Uma},
  journal = {ACM Transactions on Multimedia Computing, Communications, and Applications},
  volume  = {21},
  number  = {1},
  pages   = {1--22},
  year    = {2025},
  doi     = {10.1145/3656473},
  url     = {https://dl.acm.org/doi/10.1145/3656473}
}This Challenge is hosted by Center for Visual Intelligence, KLE Technological University, Hubballi, INDIA in collaboration with University of Tuebingen and Manipal Academy of Higher Education, Bengaluru